Showing posts with label 2017. Show all posts

Thursday, January 4, 2018

Annual Report Breeding Birds

It can be argued that recording breeding events is the most important aspect of bird observation since if the birds do not breed they will soon be extinct!  It is however a more difficult task than simple observation as: 
  • many birds go to some lengths to conceal their nests; and
  • it is necessary to be very cautious with most species to avoid frightening the birds away from the nest.
To ameliorate these problems some wide definitions of breeding are employed with the core events of "nest with eggs" and "nest with young" supported by a range of other, indirect, measures of breeding activity.  

In the case of the Canberra Ornithologists Group the traditional values ranging from breeding display to dependent young. (I sometimes feel that a new code is needed for "indolent young" when the Magpie chicks are clearly able to fend for themselves but would rather bludge off their parents.) To be rated as dependent young the fledglings 
  • must be out of the nest and generally be seen being fed by the parents or, 
  • in the case of waterbirds, be incapable of flight.   
I have made an exception for the Tawny Frogmouths where the fledglings are fed at night and it isn't possible to determine how this is achieved.  In that case the young are considered dependent until they move away from the parents some 10 weeks or so after leaving the nest.

In other countries such as Canada studies are undertaken which assume all birds seen or heard  during the breeding season are in fact breeding.  The International eBird project, run out of the prestigious Ornithology Programme at Cornell U in New York takes a very broad view with 22 codes including indirct codes such as “Singing male” (Possible breeding) and “Agitated Behaviour” (Probable breeding).  Of course, with this wide set it is possible to choose and I shall stick with the set of traditional codes used by COG for this project.  (As over 50% of COG General records are now sourced through eBird there must be some careful filtering done to map between the two systems.)

A difficulty with analysis of breeding records is that the peak breeding period in the Southern Hemisphere is split by the change of calendar year.  This is illustrated in the following chart (covering all 11 years of the project - it is very similar in shape to earlier years.
To overcome this I commenced, in mid 2009, recording the 'financial year" in which observations were made and it is possible from that point on to re-categorise observations to a "breeding year" (running from July to June).  

Since this project commenced 1004 breeding records have been noted. (i think the 1000th record was a Laughing Kookaburra.)  The decision to use the COG Breeding codes was made in late 2009 and thus approximately 12% of the records are not coded to type of activity.  Such is life, and the uncoded records are excluded from the next chart!  

The percentage of records of each type is shown separately for the last complete 'season (2016-17) and the rest of the records in the chart below.

There is not a significantly different distribution of type of activity reported in 2015-16 and the rest of the series.  The preponderance of dependent young (code 'dy') records reflects both the relative ease of observing this and the duration of the phase - for some species this can go on for several months. It is recognised that the begging young could have been hatched out of the area.  (Of course finding a nest with young does not necessarily mean the young survive to maintain the species: we have plenty of Pied Currawongs in the area to predate nests and fledglings.)

It might be noted that 87.5% of the records after December which have been coded to type of activity are dependent young. There have been several records of active pardalote, honeyeater and finch nests in the New Year.  In most cases these are presumably second broods, although the Noisy Friarbirds which nest at our place are known to be late starters.
 The incidence of type of event x month is illustrated by this chart in which the redder fill indicates a greater number of records).  Some codes have been grouped to combine the less regularly reported ones.
Following from this, the next section mostly covers 7 breeding seasons ending on 30 June 2017. The 2016-17 season will, inshallah, be reported on next year, but at this stage appears similar to history.
Breeding season# breeding records
2010-11124
2011-12137
2012-13105
2013-14118
2014-1598
2015-16125
2016-17117
It is difficult to assign reasons for the differences shown in this table - I might try to do a separate post on this later, when feeling particularly masochistic.


Taking the number of species seen in each season the following result is obtained.  

Breeding season# breeding species
2010-1150
2011-1251
2012-1349
2013-1447
2014-1541
2015-1648
2016-1744
In past years my impression was that the number of breeding species is a little more stable that the number of breeding records.  However the very low number of breeding species in 2014-15 argues against that.  I can't at this stage offer an explanation for this, but will try to ponder the issue later.

The number of reports by species received over the 11 calendar years by species is summarised in the following table.
# reports
# species
1
16
2-4
31
5-10
23
11-19
15
20+
17
As expected a large proportion of species have only been reported undertaking breeding activity a few times.  The 17 species with 20 or more breeding records are:
  • Australian Magpie (74 reports): the swooping of defending adults and the whingeing of the dependent young are hard to ignore, however much one tries.  That being said no-one reported breeding behaviour by  Magpie in 2013-14 - I didn't even get swooped riding my bike!  The situation has returned to normal since!
  • Tawny Frogmouth (47 reports): Reports from several observers this year.  Once noticed the nest and parents with dependent young are easy to relocate.  Also the breeding season is 5 months long from the start of nesting to kicking the young out.  
  • Striated Pardalote (46 reports): a serial offender at building a nest in any apparent hole in a building or tree.  Reports from several observers this year. Also very vocal when doing so! 
  • Pied Currawong (42 reports): see Australian Magpie.  In past years there was no way I could miss the {expletives deleted, with regret} pair that nested above our lawn and swoop me every time I walk across it!  For calendar 2016 and 2017 they moved nest site by 30m and were much much more sociable.
  • Welcome Swallow (36 reports):  Nest building is very obvious as they prefer a site such as in the rafters of a shed.  
  • Willie Wagtail (33 reports): Only a single record for 2016-17.  in past years records for this species cover a wide range of types of "nest-centred" events, possibly reflecting the energetic distraction displays, having the unintended outcome of leading keen observers to the nest (rather than away from it).  
  • Australian Wood Duck (32 reports)  A very common bird around farm dams and lawns, in Spring often leading a conga line of ducklings from the nest in tree hollows.
  • Australasian Grebe (30 reports)  They no longer nest on our top dam but  I have received a few more reports from other observers so they have made the big league.  The young birds are particularly interesting with striped heads.
  • White-browed Scrubwren (28 reports)  A very active bird and repeated zooming into a bush with a mouthful of grubs attracts attention.
  • Grey Shrike-thrush (27 reports): this species often nests in sheds or on verandahs, so is easy to spot.  Several observers reportedThey also fit in more than one brood so get several reports per site-year.
  • Yellow-rumped Thornbill (24 reports): Very common species and feeding young often happens out in the open.
  • Yellow-faced Honeyeater (23 reports): this species appears very relaxed about building close to dwellings - although in our case in our case the rose bush used in past years was burnt out.  So relatively easy to find and monitor the nest.
  • Common Starling (23 reports):  Frequently seen entering a hollow with a beak full of grubs!  Sometimes competes with parrots and cockatoos for use of hollows.
  • White-faced Heron (20 reports): A large and common bird which makes a large smelly nest, often quite a distance from water.
  • Superb Fairywren (20 reports): Very common bird often seen feeding young.
  • Red Wattlebird (20 reports): a large bird with very noisy fledglings.  No breeding records in 2016-17 although the species continues to be seen.

Links to other sections of this report

Annual Report: 2017 compared with 2016

During 2017 I received reports from more members of the community than in the past. These have often been single sightings of birds of interest to the observer, but are very welcome as they often fill gaps. Please keep them coming! If anyone wants to keep regular records I can provide them with a FREE! Easy to use! EXCEL spreadsheet template! Drop me an email!

Of the  195 species recorded in this project 167 species (85.1% - a slight decrease on the percentages achieved by a similar analysis last year) were reported in one or both of the years covered by this report.  Of these 167 species:
  • ·         10 were reported in 2016 but not in 2017;
  • ·         15 were reported in 2017 but not in 2016 (of which 1 was reported for the first time in 2017); and 
  • ·         142 species were reported in both years.
Looking at the entire 167 species there is a very strong correlation (correlation coefficient =  0.926) between the number of months each species was reported in the two years.  Thus it can be concluded that the two data sets are reasonably consistent.

Of the 10 species recorded in 2016 but not 2017, 
  • 7 were sighted in a single month of 2016, 
  • 2 were seen in 2 months; 
  • 1(Brown Quail) was seen in 3 months.  Tend to be seen irregularly in the area: they are skulkers so it isn't surprising that they go missing at times.
For those seen in 2017 but not reported in 2016:
  • 10 species (1 addition to the area list) were seen in a single month;
  • 3 species were seen in two months: Rufous Songlark - only seen/heard in last two months of the year;  Masked Woodswallow - an irruption in Spring; and Grey Goshawk seen at two sites more or less along the Molonglo.
  • 2 species seen in 3 months;  
    • Red-capped Robin has been very unusual in the area.  They have been reported much more in the ACT this year than the past so it isn't surprising we also got some.
    • White-bellied Sea-Eagle: Clearly seen lurking over Foxlow Lagoon, which at the time was one of the few large water features in the area.
 42 species were reported every month in both years: Last year was 43 while a similar comparisons in other recent years have shown 34 -38 species.  I am unsure what has caused the increase but see it as a Good Thing. I noted in the overview post that the set of species seen every month of the project has been very stable sitting at 19 species until last year when Willie Wagtail went walkabout for a year.  No species went AWOL this year - and willie wagtail was back at 12 months!

The following table shows the aggregate number of months in which members of the broad groups of species were seen in the two years.

Category20162017
1 Waterbirds203207
2 Birds of Prey6777
3 Parrots and Relatives100101
4 Kingfishers and other non-songbirds107116
5 Honeyeaters9290
6 Flycatchers and similar species125119
7 Thornbills, Finches and similar species189176
8 Other, smaller birds123130
9 Other, larger birds9696
The similarity of results between the two years is readily apparent.  When expressed as a percentage of total species-months the correlation coefficient is 0.99.

There is no large increase in any group.
  • The most surprising entry in the table is the small increase in the number of species-months for Waterbirds.  This is , as would be expected a balance, specifically between:
    • the larger number of species seen in January - February (when the marsh on the plain was well endowed with water) and 
    • the situation in December (when 12 less Waterbird species were seen, reflecting these species heading for the flooded areas of Victoria).
  • For Birds of prey the main difference was in July, reflecting most observers (including me) being absent in July 2016.  
  • For kingfishers etc significantly more species were reported in January and May but I can't suggest a reason!
  • Honeyeaters, Flycatchers etc and Thornbills etc show lower numbers of species in all months (notably June at 8 species less) except for July where observer effort was very low in 2016.
  • The group covered by Other smaller species were reported more frequently in the majority of months with 4 months reporting 3 or 4 additional species.
  • 8 species are included in Other larger species and they are usually reported in all months (as was the case in these two years).
The species with the largest increases in number of months-recorded have been:
  • Hardhead (going from 4 months to 12). Recovering to normal after a very low year in 2016.  (Last year it was a big decliner!)
  • Southern Boobook (from 4 months to 10).  I have no idea why this is so.  Mainly reported from Hoskinstown.
  • Straw-necked Ibis (from 1 month to 5) A very variable reporting rate for this species.  They all went West in 2016.  Again in 2016 it was a big decliner.
  • Australian King-parrot (from 9 to 12)  The species appears to be spreading from areas near Tallaganda into the Eastern part of the study region.
  • Collared Sparrowhawk (from 6 to 9)  a pair took up residence in our block for most of the year (but I couldn't find the nest).


The species with the greatest decline were:

  • New Holland Honeyeater (from 6 to 1).  Almost entirely as a result of the departure of an observer from Widgiewa Rd who used to have a small resident flock.  In 2015 it was seen 11 months!
  • Black-shouldered kite (7 to 2)  The dry start to the year meant very little prey around on the Hoskinstown Plain.  Its peak period (2012-13 it was reported nearly every month.
  • Little Corella (8 months to 5)  Last year was a big increaser.  I suspect the decline reflects us doing less dog walks to Captains Flat Rd, where most records were made.
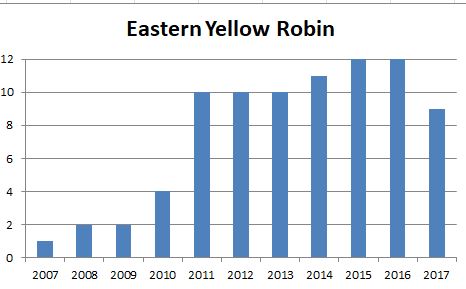
  • Eastern Yellow Robin (12 months to 9).  For the first 4 years of this project the species was very unusual.  A pair then took up residence in our yard and were recorded almost every day.  However since September 2017 they have not been sighted or heard.  No idea why.


    Links to other sections of this report

    Annual report 2017 - Overall

    This is an overall report on birds observed in Carwoola in 2017.  I have largely followed the model used for the Annual Report for 2011 to 2016, in particular the decision to adopt a multi-post approach.  However what follows has to some extent evolved during writing.  .  (For those that think the result is still too long, the Canberra Ornithologists Group Annual Bird Report is 80 A5 pages - and 2Mb to download!)

    While responsibility for the analysis in this Report is down to me, the opportunity to compile the Report is entirely due to the efforts of observers to report interesting sightings to me.  I thank you all - may this continue.

    This report will be a bit heavy on numbers but I will attempt to explain them in terms of their meaning rather than simply a barrage of percentages!  For those who wish to skip the statistics I have tried to highlight the main points in bold blue.

    I use the term Carwoola to cover the catchment area of the Stoney Creek Gazette,  As well as Carwoola itself (now united following the merger of Queanbeyan and Palerang Councils) it includes a bunch of  other localities (including Primrose Valley and, importantly from the view of birding, Hoskinstown) to the SE of Queanbeyan.  It is illustrated in this sketch map:

    The database I maintain is pretty well restricted to that area to provide some consistency.  However if very interesting birds are reported in a some what wider area:
    ·                     where people might like to go and view the birds (eg the Plumed Whistling Ducks on dams close to Bungendore); or
    ·                     the sighting suggests we should keep an eye out  in case they also turn up here
    I will also include them on this blog but not the database nor - other than mentions like this - in my reports.

    The group of folk reporting has been quite stable this year (including the return of some observers) apart from the usual emptying out in Winter.   

    By the end of 2017 we had recorded, over a 11 year period, 
    195 species in the catchment area of the Gazette (see full list here - the hyperlinks in that post take you to pages of photos).   1 species (Azure Kingfisher) was observed for the first time in 2016.  By the end of 2017  18 have been recorded in every month since this project started in 2007.  This is the same result as at the end of 2016. 

    Over the 11 year period 99 species (50.8% of species observed) have been recorded undertaking breeding activity.  2 species (Brown-headed Honeyeater and Australian King-Parrot) were recorded breeding for the first time in 2017.  More details on breeding activity are provided in another post to this blog (see link below). 

    The cumulative number of species observed for the first time or recorded breeding for the first time are shown for each year below.

    It is interesting that over a 30 year period the Garden Bird Survey, run by the Canberra Ornithologists Group has recorded 239 species with 108 of these (46.2%) recorded as breeding.  Given the much shorter time span and far fewer observers I think we have, to quote Young Mister Grace, "...all done very well."

    In 2017, 156 species were recorded in the study area.  This is the  equal highest number recorded in the study area (equal to the number of species reported in 2015) and amounts to 79.5% of those ever recorded in the area.  This graph shows the number of species recorded per year.

    The weather for 2017 is reviewed here  and appears not to have had a great impact on the birds around the area. This is particularly surprising in view of the year being very dry and our own block, among many others, being incinerated in the February 17 fire.  I fact I have been very surprised at the diversity around our house since the fire with more species of birds seen in that area in the period July to December 2017 than for any similar period since 2007.

    In 2017 30.9% of the species recorded were observed undertaking some form of breeding activity.   This is a small decrease on 2016 but is still similar to other recent years.


    Links to other sections of this report


    Annual Report 2017: 2017 compared with 10 previous years

    A starting point is the number of species reported in each month.

    In the table-image above (which becomes much more legible if you click it) the year in which the highest number of species was observed for each month is highlighted in green.  Most of these months occur between September 2011 and May 2013 when observer activity was at peak levels and abundant rain fell, leading to an explosion of water birds on the Hoskinstown Plain. However we did establish new high marks in November 2015 and April and June 2016.

    While we usually short of observers (including this author) in the July, the row showing 2017 as a % of the average for the period since 2010 shows that we are still holding up.  Thank you to all observers who have contributed observations.

    As reported in the overview we added 1 species to the list in 2017.  

    18 species have been recorded in every month throughout the 9 years (obviously including every month of 2017) These are:


    • Australian Wood Duck; Galah; Sulphur-crested cockatoo; Crimson Rosella; Eastern Rosella; Laughing Kookaburra; White-eared Honeyeater; Noisy Miner; Magpie-lark; Welcome swallow; Yellow-rumped thornbill; White-throated treecreeper; Common starling; Grey butcherbird; Australian Magpie; Pied Currawong; Australian Raven; Little Raven.
    A simple way of summarising the difference in reporting rate between 2015 and earlier years is by a tree diagram.


    The number shown as 'same' is those where the % of available months (106 in total for earlier years, 2 months are missing) is within +/- 5%.   This allows for differential observer effort affecting the result by a small amount.
      
    The pattern shown in that tree is somewhat different to that from 2015.  This "comparison of comparisons" is summarised in the following table.

    Comparison with previous years
      less same more
    2015    16  58  77
    2016    27  64  60
    2017    22  75   58
    My conclusion is that the team of observers have got to a point where we know what birds are around and where to find them so the species with the same reporting rate are increasing while those getting reported more frequently are decreasing.

    The next table shows the number of increasers and decreasers by category of bird.  (I should point out that these categories are rather arbitrary, but just provide a few groupings that cover birds of broadly similar behaviours and/or habitats.)

    CategoryDecreasersSimilarIncreasers
    1  Waterbirds11520
    2 Birds of Prey266
    3 Parrots and Relatives054
    4 Kingfishers and other non-songbirds499
    5 Honeyeaters1102
    6 Flycatchers and similar species474
    7 Thornbills, Finches and similar species892
    8 Other, smaller birds289
    9 Other, larger birds071
    Total 227657

    Many of the changes have been hinted at in earlier sections. 

    The high number of 'increasers' in waterbirds was somewhat of a surprise in view of the exodus of such birds referred to in several parts if this Report.   


    In some cases - not only waterbirds - a rating of increaser may be an artefact of arithmetic, because 
    • a sighting a species in 1 month of 2017 (which infers the bird is unusual) is equivalent to 8.3% 
    • if it was only reported in 3 or less months of the preceding 10 years (quite likely for an unusual bird) it would still meet the "rule" for increase whereas in fact it was simply an unusual bird of about the same reporting rate.  4 Waterbirds and 2 others meet this situation. .
    Also I, at least, have been more aware in recent years which water features were likely to be productive.  For example Musk Duck and (particularly) Black Swan are nearly always observable when looking down on Foxlow Lagoon (but nowhere else).

    Flycatchers etc and Thornbills etc may be a cause for concern as they have several decreasers and few increasers.  Of course a single years observations are insufficient to prove this: I shall investigate further when I work out exactly how to do that.


    The results for Parrots, Honeyeaters and Other larger birds all indicate a stable situation.

    No group showed a noticeable drop.

    Links to other sections of this report